Atlético Madrid 2–0 Manchester United: The Dominance That Began Before the Red Card
Atlético Madrid defeated Manchester United 2-0, but the red card was only part of the story. StatsLook's xG data, Pressure Index and player statistics reveal how Simeone's side established control before Lookman sealed the victory.
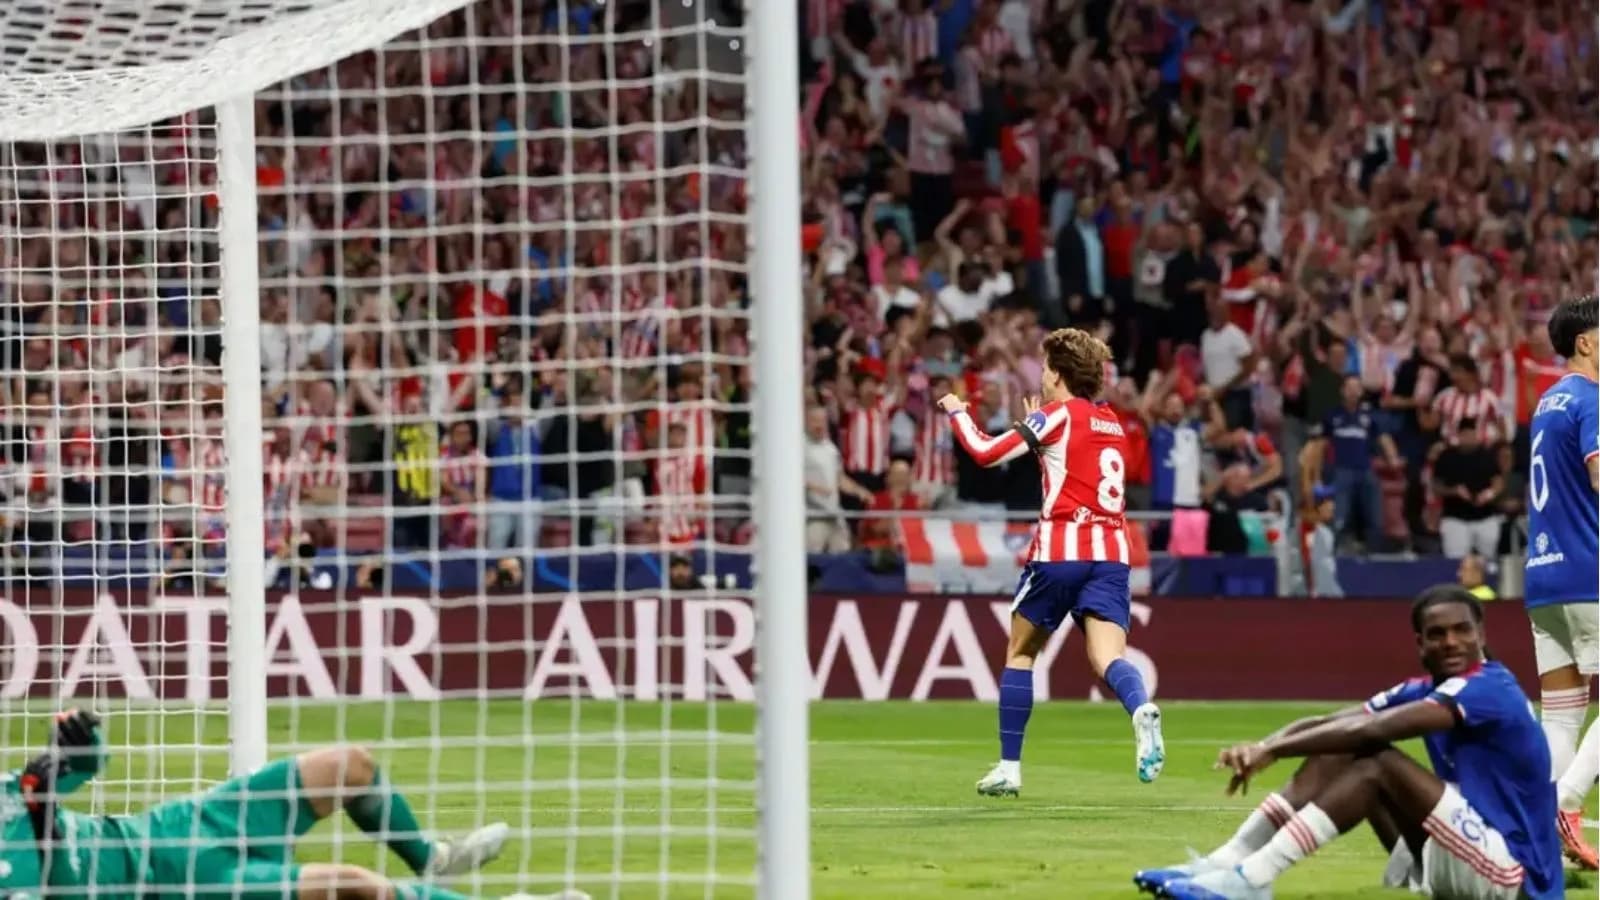
Atlético Madrid secured their first Champions League victory of the season with a 2–0 win over Manchester United. Pablo Barrios struck in the opening minute before Ademola Lookman sealed the result after Leny Yoro's dismissal. But StatsLook's match data reveals a deeper story: Atlético were already establishing control long before United went down to ten men.
14 October 2026 | StatsLook Match Analysis
Atlético Madrid could hardly have asked for a faster start at the Riyadh Air Metropolitano.
Just 47 seconds into their Champions League encounter with Manchester United, Pablo Barrios opened the scoring after Álex Baena created the opportunity. Barrios' low effort took a deflection off Ayden Heaven and beat Senne Lammens.
The hosts had their early advantage, but the game was far from settled.
Manchester United created opportunities to equalise, Atlético enjoyed extended periods of territorial pressure, and the contest remained within one goal until the 74th minute, when Leny Yoro was sent off following a VAR review.
Five minutes later, substitute Ademola Lookman doubled Atlético's lead.
The final score was straightforward. The underlying numbers tell a more nuanced story.
Similar Attack Volumes, Different Levels of Threat
One of the most revealing statistics from the match was the relationship between total attacks and dangerous attacks.
According to StatsLook, Manchester United recorded 103 attacks compared with Atlético Madrid's 101.
Yet Atlético held a clear advantage in dangerous attacks, producing 45 to United's 32.
That represents approximately 41% more dangerous attacks, despite recording slightly fewer attacks overall.
The difference was also visible in possession and passing.
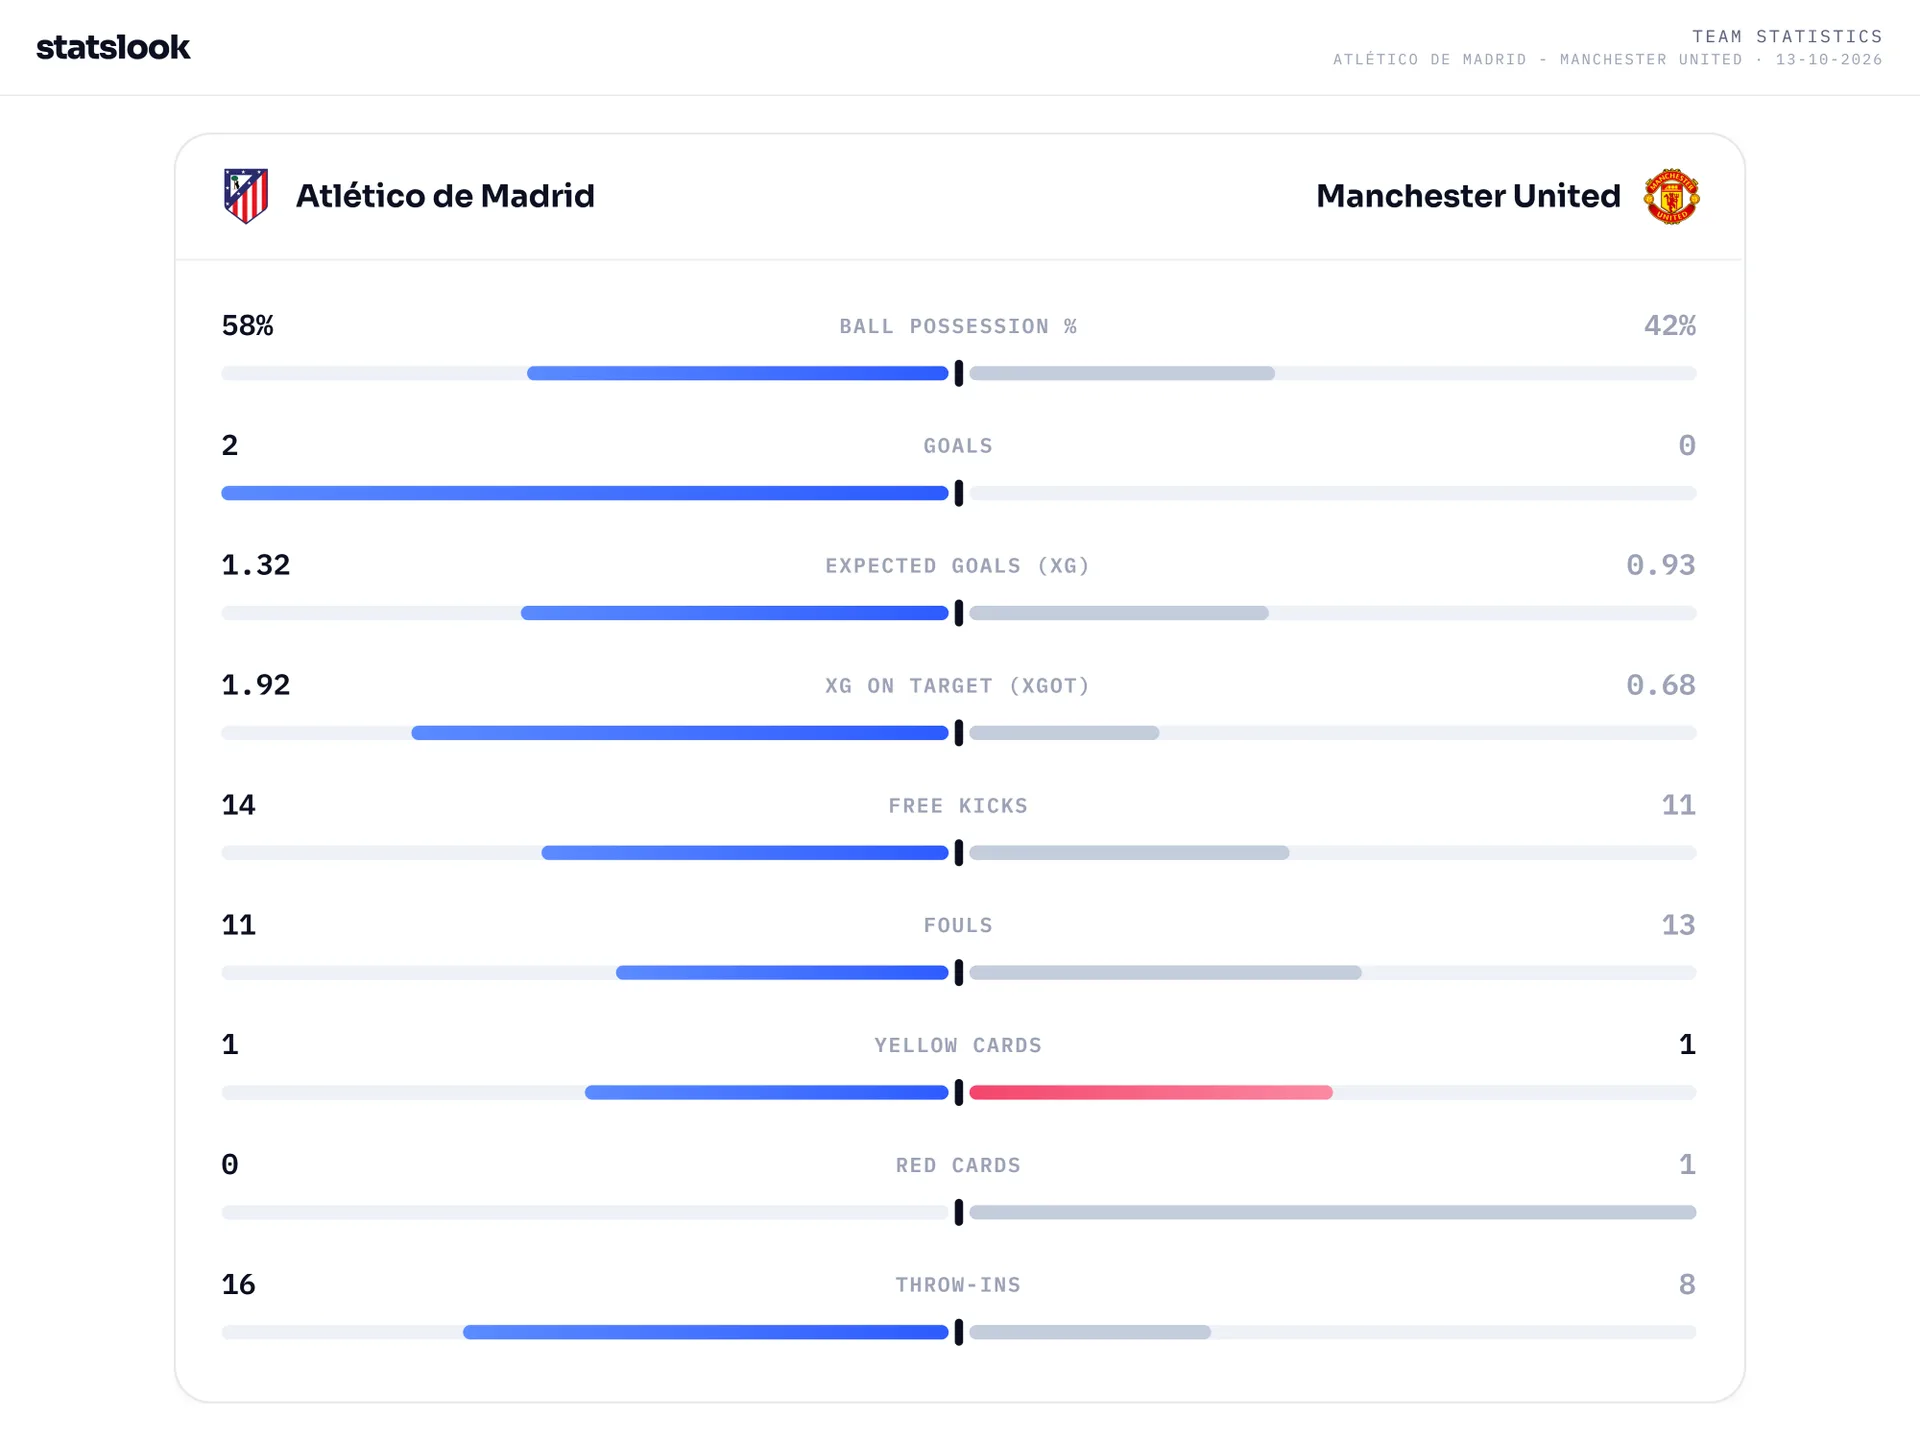
Atlético controlled 58% of possession and completed 576 of their 652 passes, an accuracy rate of approximately 88%.
Manchester United held 42% possession and completed 395 of 466 passes, approximately 85%.
These figures suggest that the home side were more successful at sustaining possession and developing threatening attacking situations.
United advanced forward frequently enough to remain competitive in total attack volume, but those attacks translated into fewer dangerous situations.
The distinction matters: the number of attacks alone did not accurately describe the balance of attacking threat.
The Pressure Index: Atlético's Control Was Established Earlier
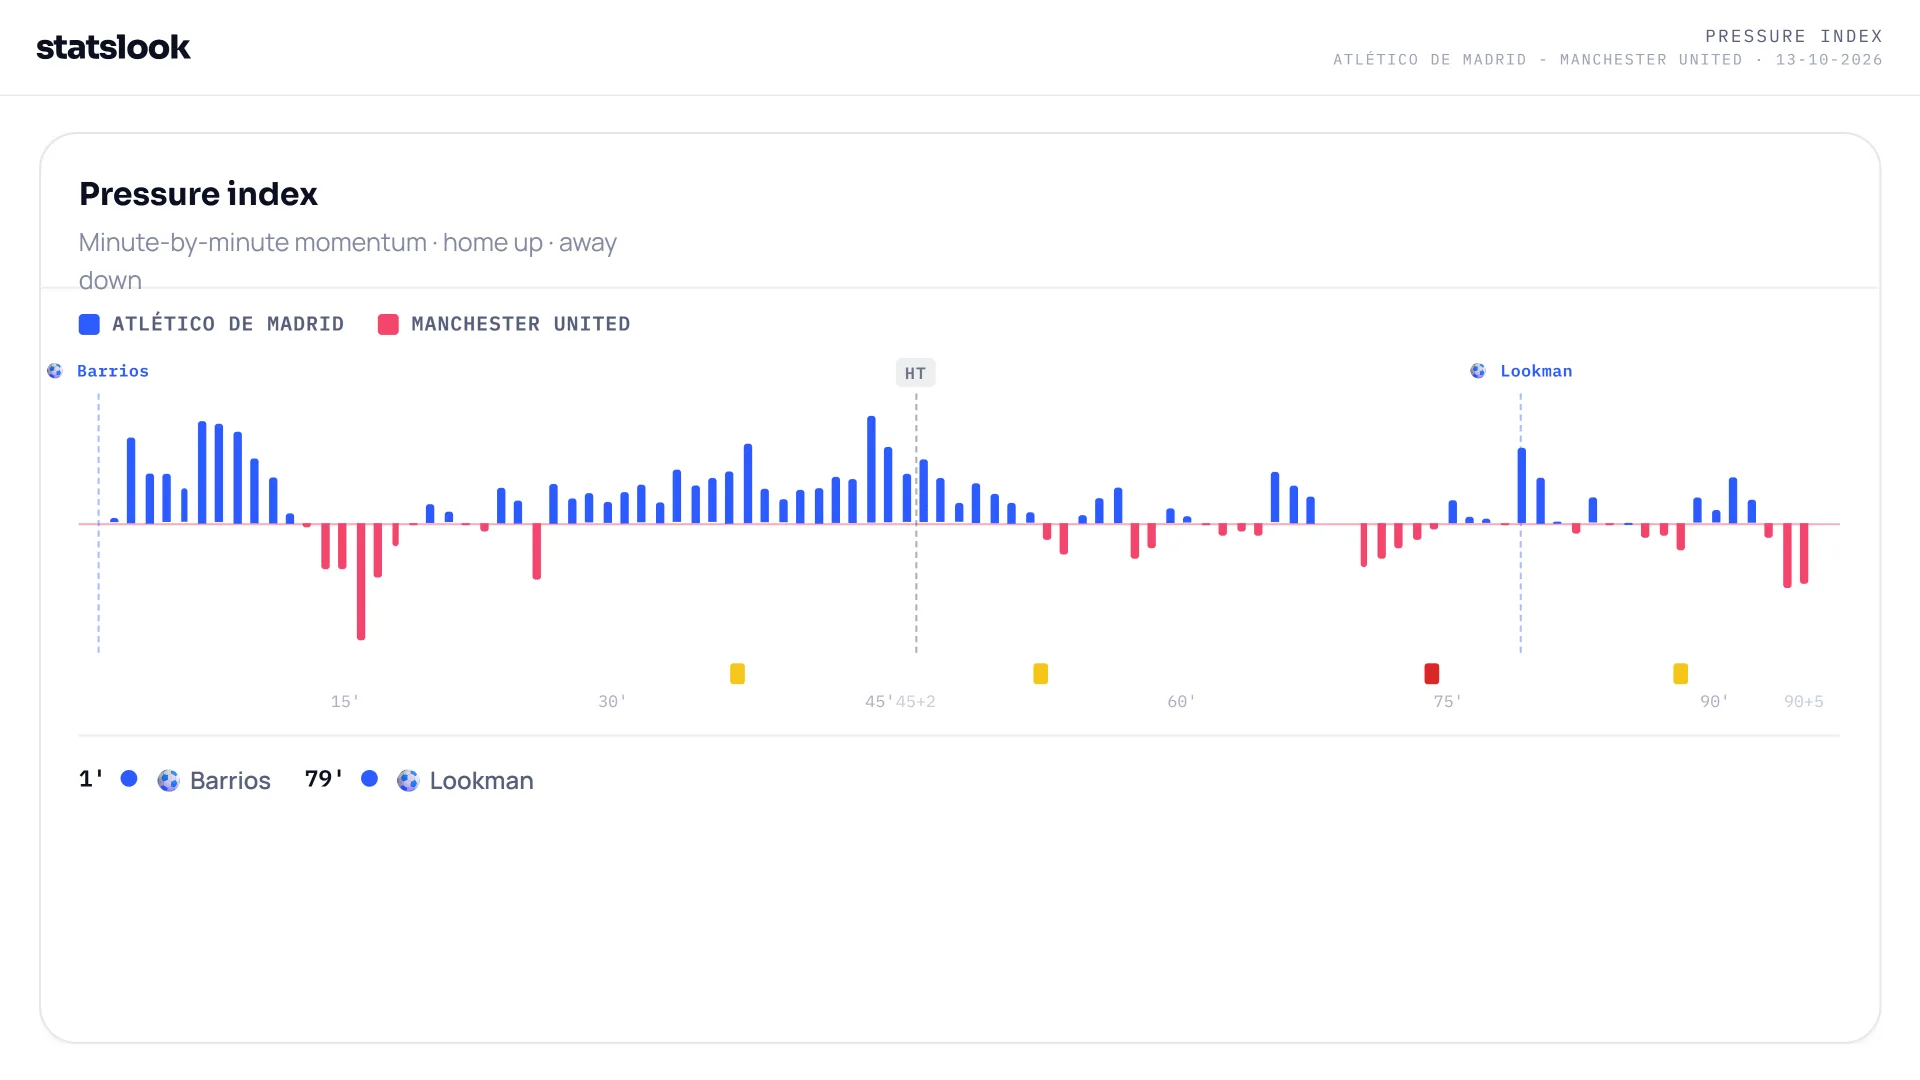
StatsLook's Pressure Index reveals why the red card should not be treated as the sole explanation for Atlético's victory.
United had a productive spell between the 13th and 19th minutes, registering two shots worth 0.32 xG.
The visitors were not simply spectators.
However, Atlético subsequently established an extended period of pressure between the 20th and 54th minutes.
Across that window, Diego Simeone's side registered four shots worth 0.30 xG, maintaining pressure without converting another opportunity.
The hosts also came close through Alejandro Grimaldo, whose free-kick struck the woodwork.
Johnny Cardoso appeared to have doubled Atlético's advantage before half-time, but the goal was ruled out following a VAR review for handball in the build-up.
Despite those moments, Atlético led by only one goal at the interval.
The Pressure Index indicates that the hosts enjoyed longer periods of momentum, while United's attacking responses were more concentrated.
It does not suggest that every minute belonged to Atlético. Rather, their periods of control were sustained enough to shape the game's overall direction.
The Red Card Changed the Conditions, Not the Entire Story
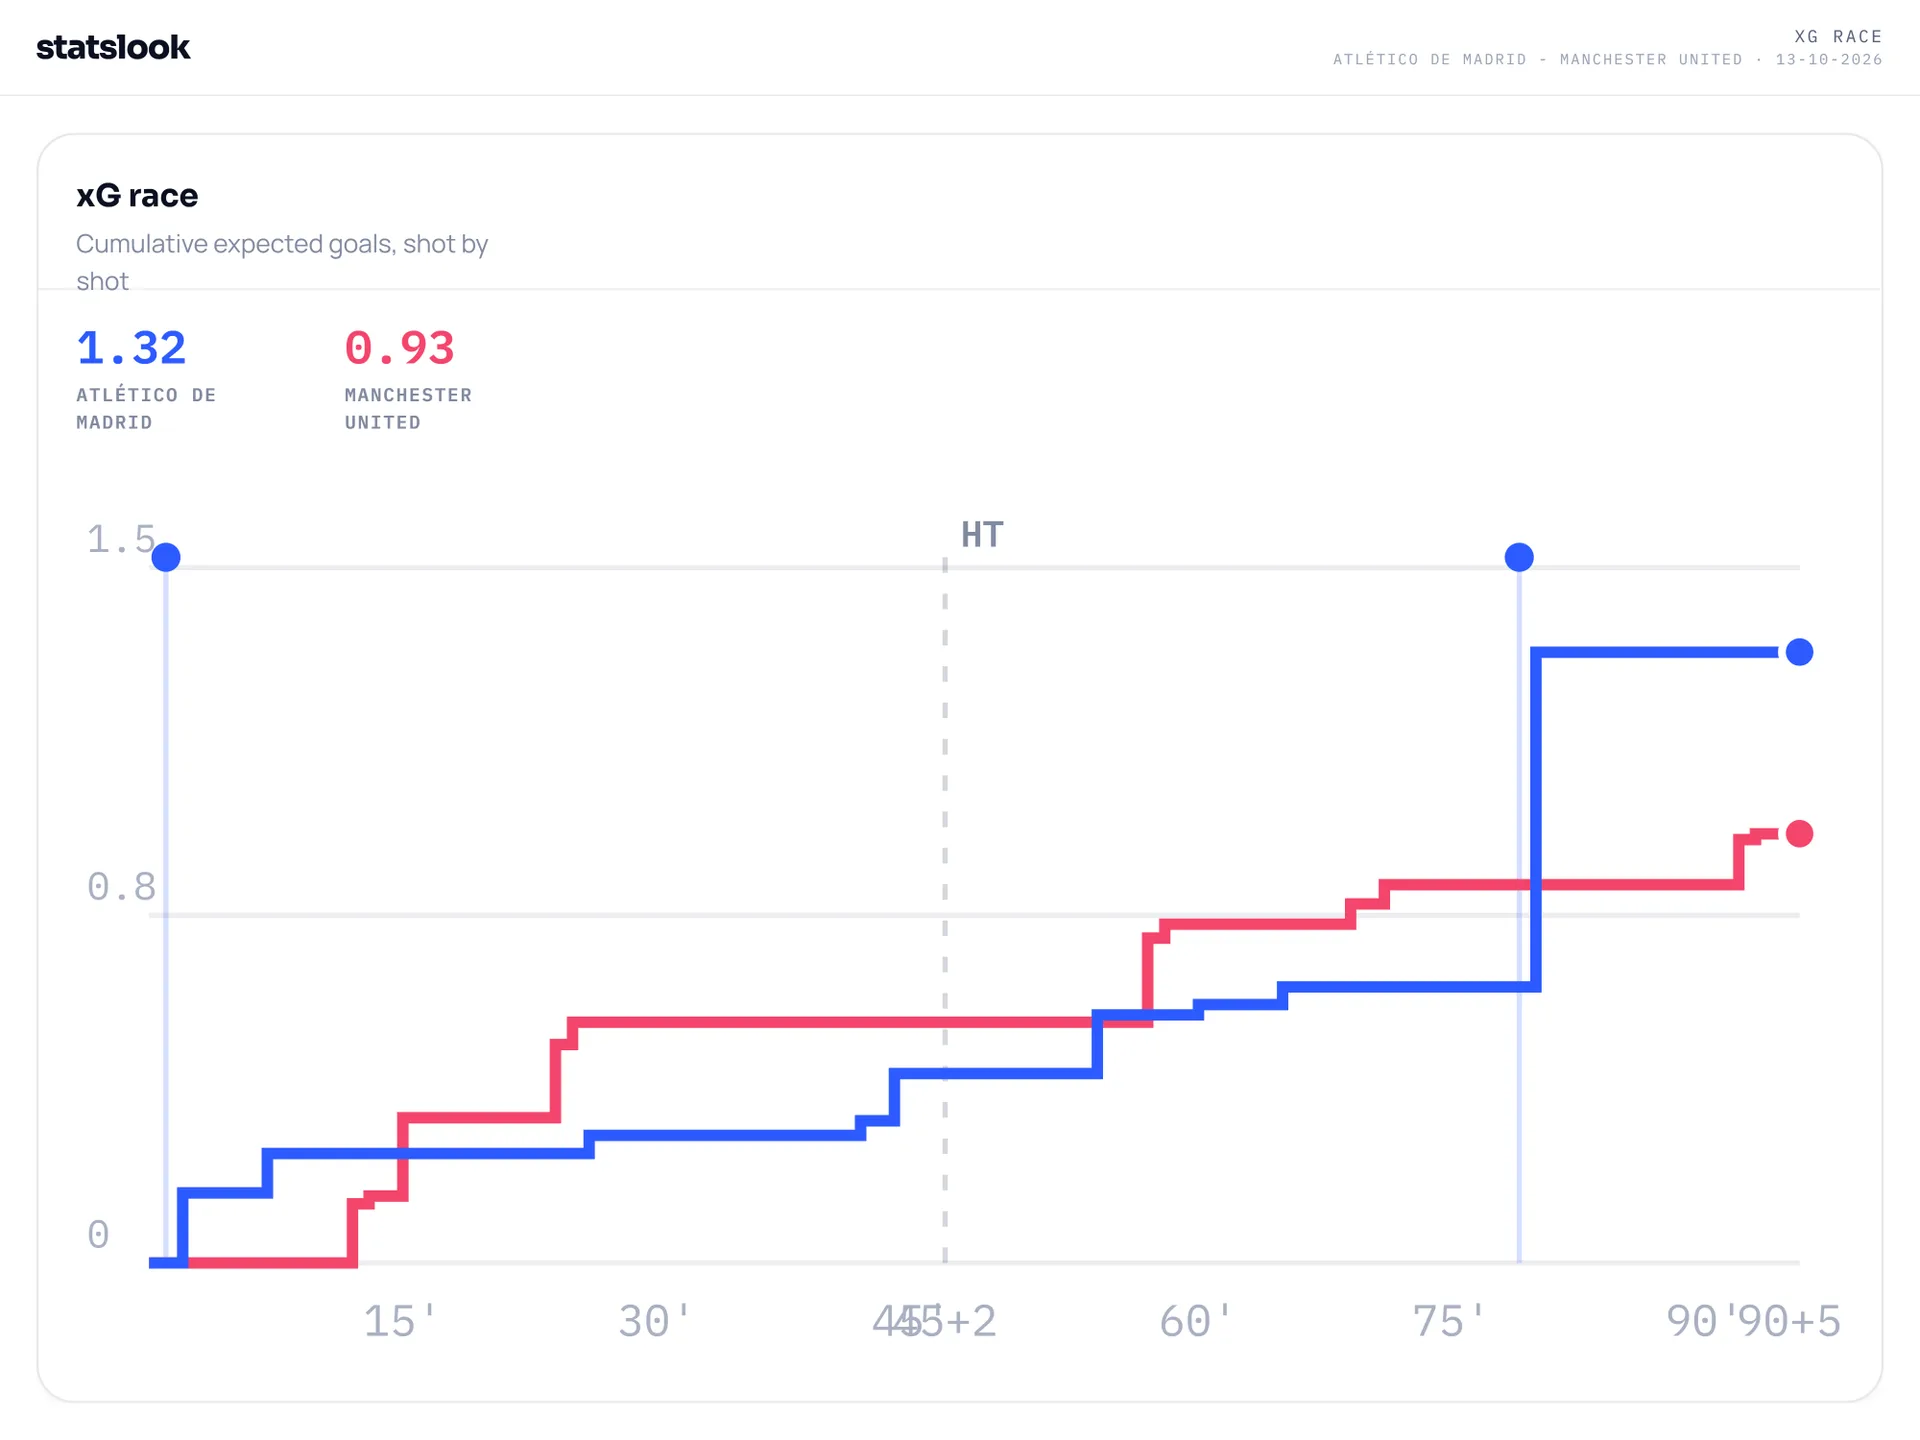
Manchester United's task became considerably more difficult in the 74th minute.
Leny Yoro was dismissed following a VAR review after denying Jonathan David a goalscoring opportunity.
With United reduced to ten men, Atlético were able to exploit the changing circumstances.
Lookman's second goal arrived just five minutes later.
StatsLook's Pressure Index identifies a further Atlético attacking window between the 78th and 87th minutes, during which the home side registered two shots worth 0.73 xG and scored once.
That window illustrates the quality of the opportunities Atlético created late in the match.
The red card therefore marked a major turning point, but it did not erase what had happened before it.
Atlético had already taken the lead, controlled more of the ball and enjoyed extended periods of attacking pressure.
The dismissal helped turn that advantage into a two-goal victory.
Ademola Lookman: 19 Minutes, 10 Touches, One Decisive Goal
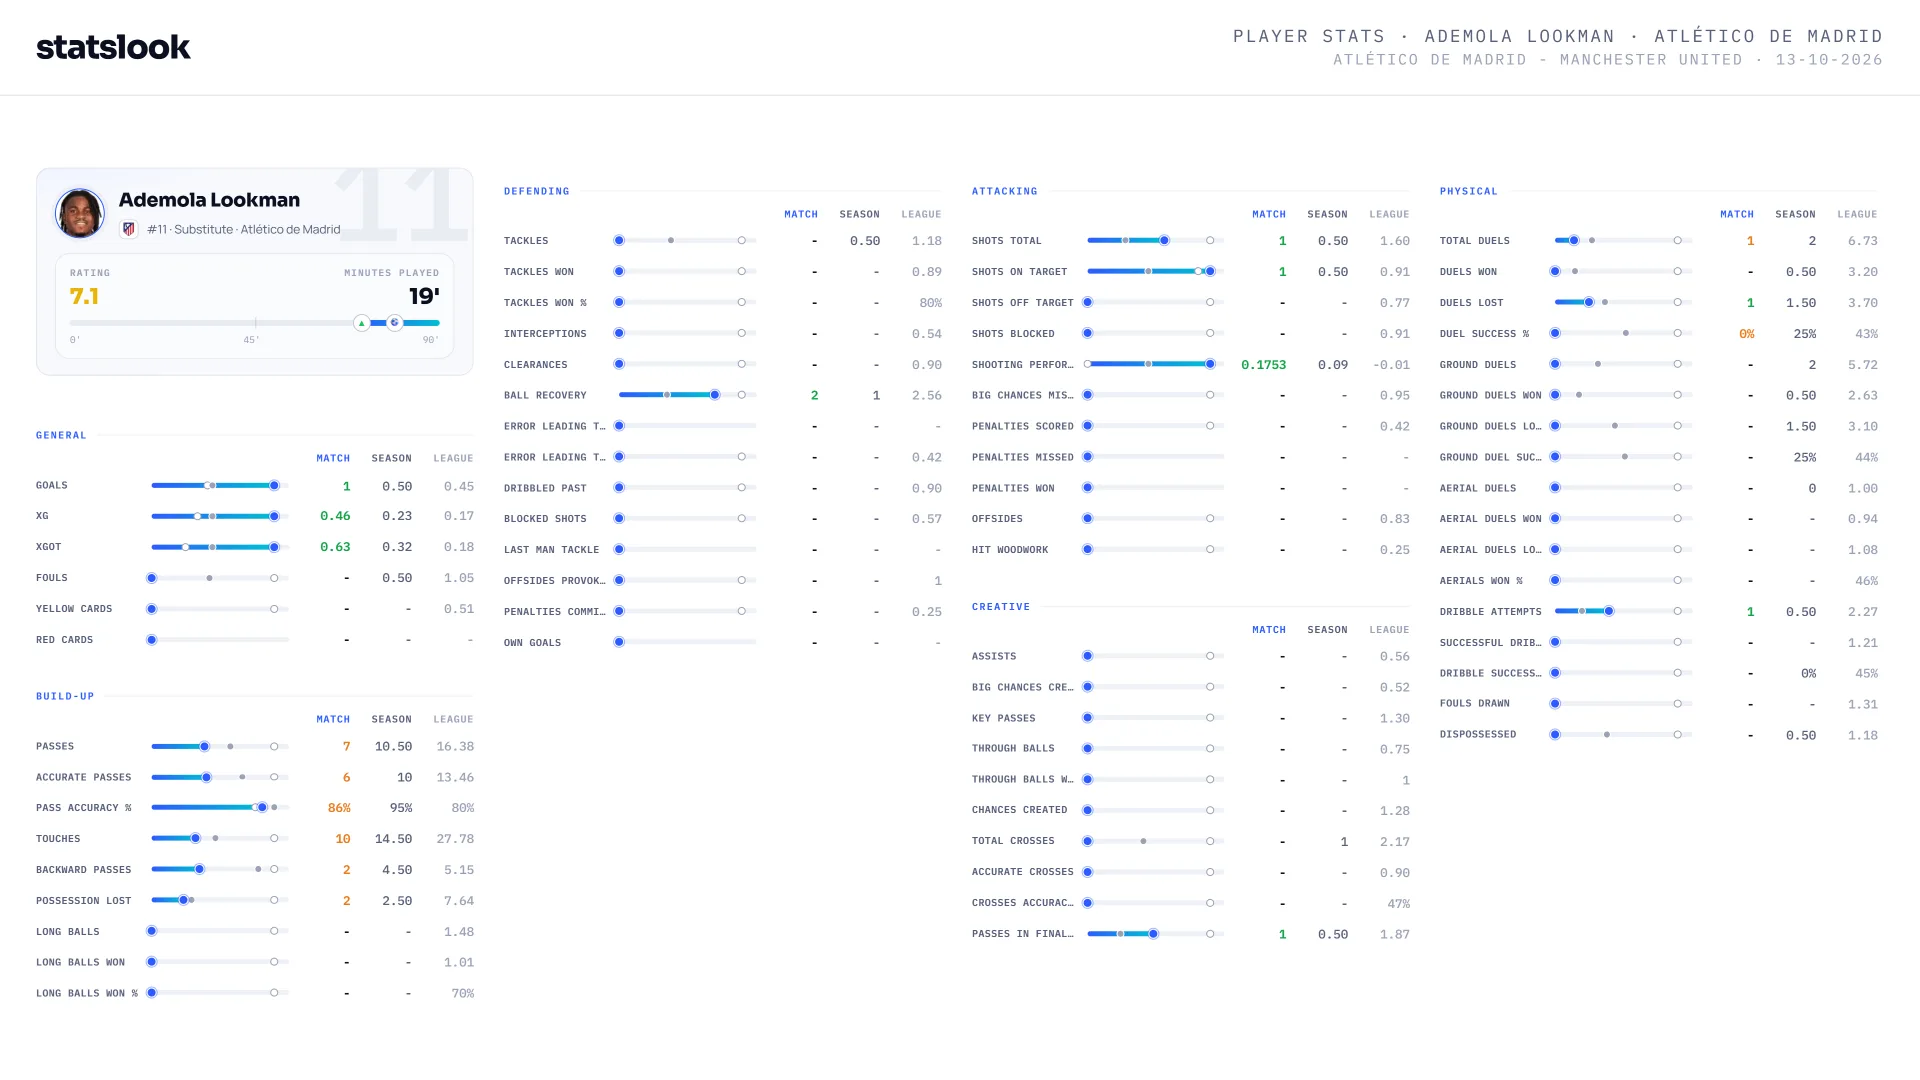
Lookman's performance was a reminder that impact is not always measured by involvement volume.
The substitute spent just 19 minutes on the pitch and registered only ten touches.
He attempted seven passes, completing six, and took one shot.
That shot became Atlético's second goal.
StatsLook assigned the opportunity 0.46 xG, while its post-shot expected-goals-on-target value reached 0.63 xGoT.
Lookman's single attempt therefore accounted for approximately 35% of Atlético's total 1.32 xG.
His contribution was concentrated in one high-value opportunity.
Barrios' opening goal had a different statistical profile.
The midfielder scored with his only shot of the match, worth 0.16 xG.
Across 60 minutes, he also completed 49 of 52 passes and delivered two key passes.
Atlético's two goals thus came from markedly different opportunities: an early lower-probability attempt and a late chance with substantially greater pre-shot scoring probability.
Both were decisive.
Manchester United's 0.93 xG: Chances Without a Goal
Manchester United finished the match with 0.93 xG and 0.68 xGoT, according to StatsLook.
Bryan Mbeumo and Bruno Fernandes were responsible for a substantial share of United's attacking output.
Each generated 0.29 xG, meaning the two players combined for 0.58 xG — approximately 62% of their team's total.
Fernandes recorded three shots, the highest individual total for United, while Mbeumo attempted two.
The visitors also managed four shots on target.
But none resulted in a goal.
Jan Oblak made four saves, including three from attempts inside the penalty area, and finished the night with a clean sheet.
United's xG and xGoT figures describe two distinct stages of shooting quality: the estimated scoring probability of their attempts before the shots were struck, and the goal threat of those that reached the target.
The difference should not be interpreted as definitive evidence of poor finishing by itself, but the outcome was unmistakable: United could not convert their opportunities.
A Defensive Contrast: 21 Tackles Against Five
The defensive statistics offer another interesting contrast.
Manchester United recorded 21 tackle attempts, while Atlético Madrid made just five.
Despite that considerable difference, ball recoveries were almost identical:
Atlético Madrid: 48
Manchester United: 47
Atlético also recorded 12 interceptions, twice United's six.
Cristian Romero led the home side with five interceptions, while Marcos Llorente added two interceptions and won five of his eight duels.
These numbers demonstrate why tackle volume should not be treated as a standalone measure of defensive performance.
Atlético spent more time in possession and recorded a different distribution of defensive actions, with interceptions contributing notably to their work without the ball.
More tackles did not necessarily translate into greater overall control.
Final Verdict: Atlético's Advantage Was Built Before It Was Secured
Atlético Madrid's 2–0 victory was shaped by three distinct phases.
First, Barrios' goal gave the hosts an advantage inside the opening minute.
Second, Atlético established longer periods of pressure, particularly between the 20th and 54th minutes, while maintaining an edge in dangerous attacks and possession.
Third, Yoro's dismissal changed the conditions of the final stages, and Lookman capitalised on a high-value chance to secure the result.
For Manchester United, the defeat reflected both their difficulties in limiting Atlético's threatening attacks and their inability to convert the opportunities they created.
The red card helped Atlético secure the win. The foundation of their superiority had already been established.
That is the central finding from StatsLook's analysis: the scoreline was determined by two goals, but the game was shaped by the changing balance of possession, pressure and opportunity quality across 90 minutes.
Data: StatsLook | Atlético de Madrid 2–0 Manchester United | UEFA Champions League, 13 October 2026.
Explore xG, xGoT, player performances and match momentum on StatsLook.