What Possession Is Worth: City, Brighton, United and Spurs After Five Games
Manchester City, Brighton, Manchester United and Tottenham have posted similar possession numbers through five Premier League matches, but the football underneath them could hardly be more different.

Five matches is too small a sample to define a season, but it is long enough for certain patterns to become difficult to ignore. Manchester City, Brighton, Manchester United and Tottenham have all tried to dominate the ball, all spent long periods in opposition territory and all started the campaign with broadly similar possession shares.
What they have done with that possession is where the separation begins.
City have won all five and sit top with 15 points. Brighton have 10 points and the league’s most productive attack. Manchester United have only five points despite posting the best expected-goal difference of the four. Tottenham, meanwhile, sit bottom with two points and have turned a possession share above 60 per cent into one of the weakest attacking outputs in the division.
Their expected-goal difference per game captures the divergence neatly: United are at +1.03, City +0.89, Brighton +0.45 and Tottenham -0.63.
Those numbers do not overturn the table. They explain why each team has arrived where it has in a different way.
Brighton: The Attack Is Real, the Scorelines Are Flattering
The obvious number is 16 goals in five matches. Brighton beat Aston Villa 4-0, lost 4-3 at Chelsea, drew 1-1 with Leeds, put five past Coventry and beat Arsenal 3-0. But the significance of their start lies less in the raw goal total than in what sits underneath it.

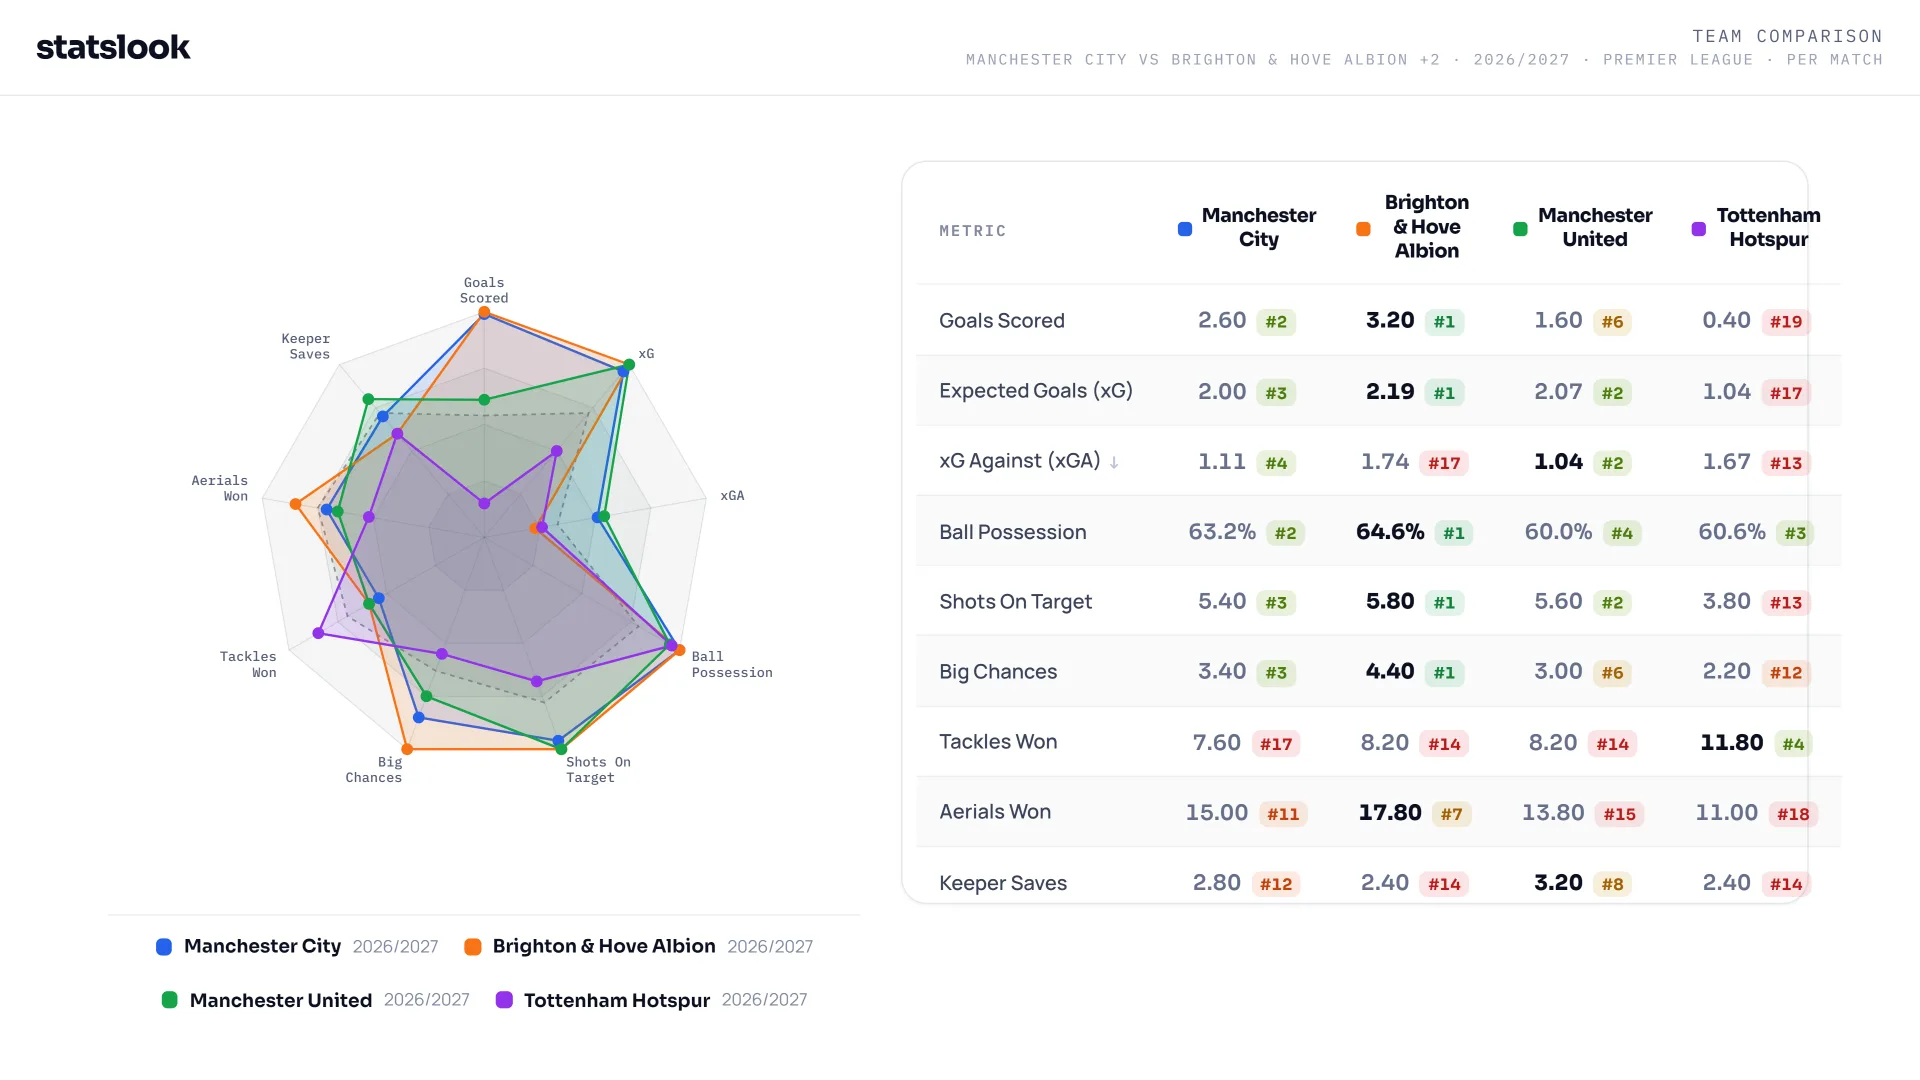
Fabian Hürzeler’s side lead the Premier League with 2.19 xG per game, 5.80 shots on target, 4.40 big chances and 64.6 per cent possession. That matters because it tells us Brighton are not simply riding an unsustainable finishing streak with little beneath it. They are reaching dangerous areas repeatedly, creating high-quality chances and spending enough time in possession to keep opponents under pressure.
The caveat is at the other end. Across five matches, Brighton have generated roughly 10.95 xG and allowed about 8.70 xGA. The actual scoreline across those games is 16-5.
That is a much brighter picture than the underlying chance balance.
Brighton have scored around five goals more than their xG would suggest, while conceding almost four fewer than expected. Their actual goal difference is +11; their expected-goal difference is only around +2.25.
That does not invalidate the attacking performance. The attack is the strongest part of the profile and is supported by multiple metrics. What it does suggest is that the current margin of superiority is unlikely to remain this extreme if the defensive exposure stays the same.
The 4-3 defeat at Chelsea is probably the cleanest summary of Brighton so far. They are dangerous enough to hurt almost anyone, but not controlled enough to prevent games from becoming unstable.
The question is therefore not whether Brighton can keep creating chances. The numbers suggest they can. The more important question is whether they can continue collecting points while giving opponents this much access at the other end.
Manchester City: Not Always in Control, Always Finding a Way

City’s points record is perfect: five games, five wins, 15 points.
The performances have not been perfect in the same way.
A 5-3 win over Sunderland showed a side willing to survive a chaotic game. The 1-0 win over Manchester United showed the opposite: a tighter contest, fewer margins, the same outcome. Under Enzo Maresca, City have not needed every victory to look identical.
That flexibility is part of the story.
City are averaging 2.00 xG per game, slightly below Brighton and United, while scoring 2.60 goals per game. Their attacking numbers remain strong, but they are not currently the league’s most aggressive chance-producing side.
The difference is balance.
City’s xGA sits at 1.11 per game, comfortably below Brighton’s 1.74. Across five matches, that works out at roughly 10.0 xG created and 5.55 xGA allowed, compared with an actual scoreline of 13-5.
The defensive side of that relationship is almost perfectly aligned. City have conceded almost exactly what the quality of the chances against them would predict. The attacking side is running ahead of expectation, but not to the same extraordinary degree as Brighton.
That gives City a different route to results. Brighton may need to score three or four because their matches can become open. City can win 1-0, or they can survive 5-3. They do not need to dominate every attacking metric because they are giving themselves a smaller margin to overcome defensively.
That is the distinction worth preserving after five matches. City have not necessarily been the most overwhelming team in every game. Their points line is perfect; their control has not always been.
In a league season, that difference matters. Teams that can win without requiring their best attacking performance every week usually give themselves more ways to survive poor spells.
Manchester United: Five Points Hide a Much Better Process
Manchester United’s first five matches are uncomfortable precisely because the results are worse than the underlying performance.
Five points. Eight goals scored. Eight conceded. A place in the middle of the table.
That looks ordinary.
The process does not.
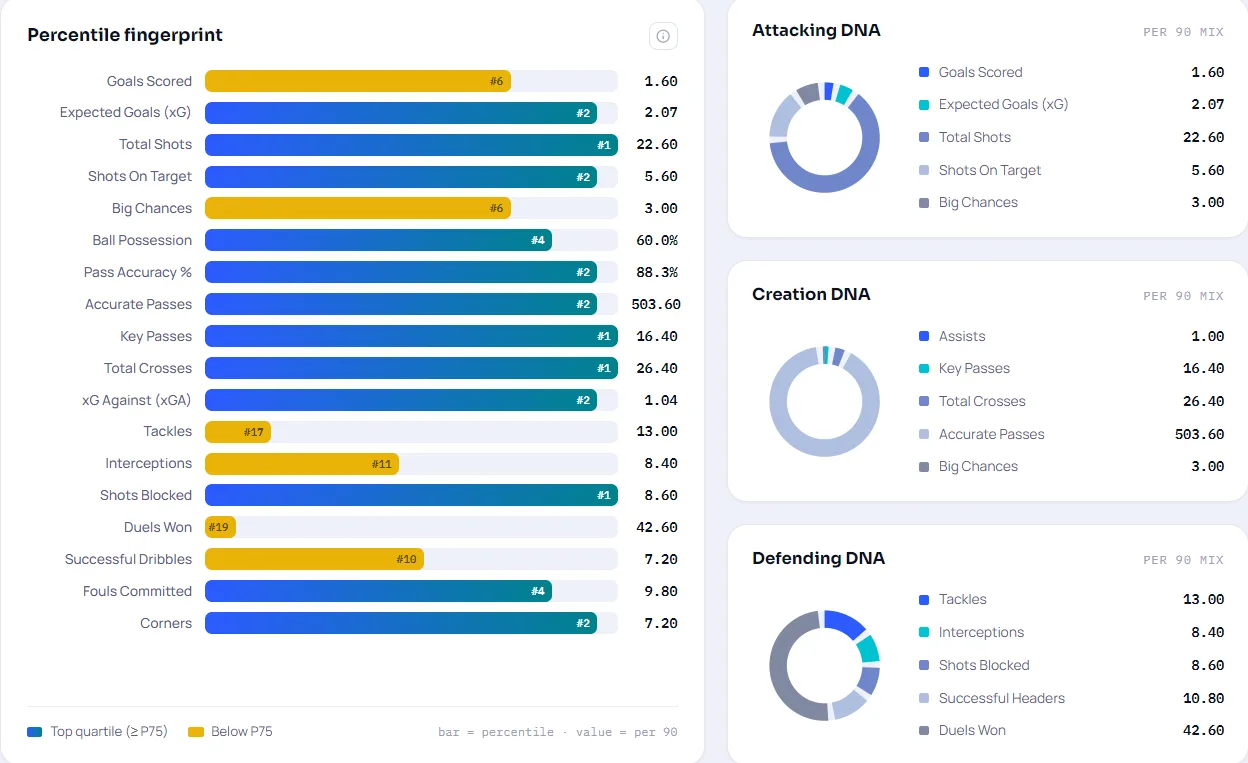
United are averaging 2.07 xG per game and only 1.04 xGA, while producing 5.60 shots on target and 3.00 big chances per match. Their expected-goal difference of +1.03 per game is the best of these four teams.
Over five matches, that comes to roughly 10.35 xG and 5.20 xGA.
The actual scoreline is 8-8.
United are underperforming at both ends at the same time. They have scored a little over two goals fewer than their chance quality suggests and conceded almost three more than expected.
That is why a 2-2 draw at Everton, a 1-1 draw at Fulham and a 1-0 defeat to City feel related despite being different types of match. United are getting into good enough positions to win more often than they have, but the margins in the two penalty areas are currently moving against them.
The important distinction is with Tottenham.
United’s attacking structure is not failing to create. They are getting shots on target, producing high xG and generating a positive territorial balance. The problem comes later: finishing, extending a lead, killing a match and making good phases of play count on the scoreboard.
That does not mean the points will automatically correct themselves. Five-match xG is not a promise of future results. But it does mean United’s five points should not be read in the same way as a team playing poorly and scraping five points.
The process is better than the table.
Now it has to become productive.
Tottenham: The Problem Begins Before the Finish
Tottenham’s situation is different because the weakness appears earlier in the attacking chain.
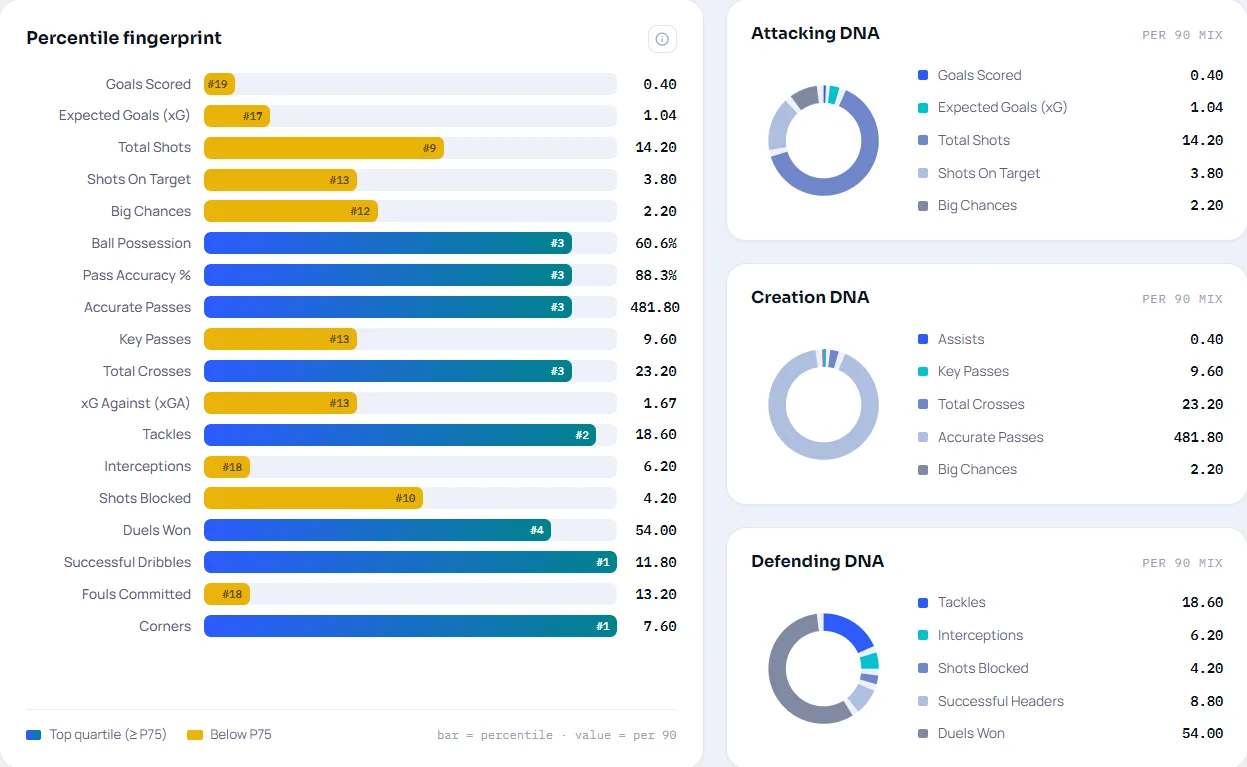
Roberto De Zerbi’s side average 60.6 per cent possession, a figure close to City and Brighton. The issue is not gaining the ball or keeping it. The issue is what happens before possession becomes a chance.
Spurs are averaging only 1.04 xG, 0.40 goals, 3.80 shots on target and 2.20 big chances per match.
They failed to score in their first four league games: 3-0 against Brentford, 2-0 against Newcastle, then goalless draws with Nottingham Forest and Everton. Their first league goals arrived in the 3-2 defeat to Aston Villa.
After five matches, they have scored only twice.
Tottenham have produced roughly 5.20 xG in total, so finishing is clearly part of the problem. Two goals from that chance quality is poor. But this is where the United comparison becomes useful.
United are producing 2.07 xG per game and failing to convert enough of it.
Tottenham are producing 1.04.
They are not only wasting chances. They are failing to create enough of them in the first place.
The defensive picture is even less forgiving. Tottenham have allowed roughly 8.35 xGA and conceded eight goals. There is almost no statistical distortion there. Unlike United, they are not conceding far more than their underlying numbers suggest. Unlike Brighton, they are not being rescued by opponents missing chances.
They are conceding roughly what they should concede.
That is why framing Tottenham’s start as bad luck would be misleading. They have the ball, but not enough threat. And when they lose it, opponents are creating enough quality to punish them.
Possession, in this context, is not control. It is simply possession.
That distinction may be the biggest challenge for De Zerbi. His side are spending enough time with the ball to look dominant in broad terms, but not producing enough movement, penetration or penalty-box disruption to make that dominance meaningful.
Tottenham have possession of the match without possession of the game.
Similar Possession, Completely Different Football
The most revealing comparison between these four teams may be the simplest one.
Brighton average 64.6 per cent possession, City 63.2, Tottenham 60.6 and United 60.0. There is only 4.6 percentage points between the highest and lowest.
Their attacking output is nowhere near as close.
Brighton average 2.19 xG, United 2.07, City 2.00 and Tottenham 1.04.
Tottenham are only four percentage points behind Brighton in possession, yet they are producing less than half as much expected-goal value.
That is the clearest reminder that possession itself is not an identity.
Brighton use it to overload and attack.
City use it to manage rhythm and risk.
United are reaching good positions but failing to convert them into enough goals.
Tottenham are losing value earlier in the sequence.
The raw share of the ball tells us very little unless we know what happens next.
United v Tottenham: Two Bad Starts, Two Different Problems
That is what makes Manchester United against Tottenham after the international break such an interesting early-season test.
The table will show two teams under pressure.
The underlying numbers show two entirely different problems.
United are running at 2.07 xG and 1.04 xGA per game.
Tottenham are at 1.04 xG and 1.67 xGA.
United’s issue is converting superiority into results.
Tottenham’s issue is establishing superiority in the first place.
One side is wasting the chances it creates.
The other is not creating enough of them.
That makes the fixture more than a meeting between two teams who need points. It is a useful test of whether United can finally turn process into outcome, and whether Tottenham can begin to turn possession into something more dangerous than territory.
Conclusion
The first five weeks have separated Manchester City, Brighton, Manchester United and Tottenham in ways the league table alone cannot explain. Five matches are not enough for final judgments, but they are enough to expose different kinds of strength and weakness. The early Premier League story is not simply about who has more of the ball, who scores the most or who sits highest. It is about what each team is actually doing with its control.