How to Compare Football Teams: A Data-Driven Analysis Guide
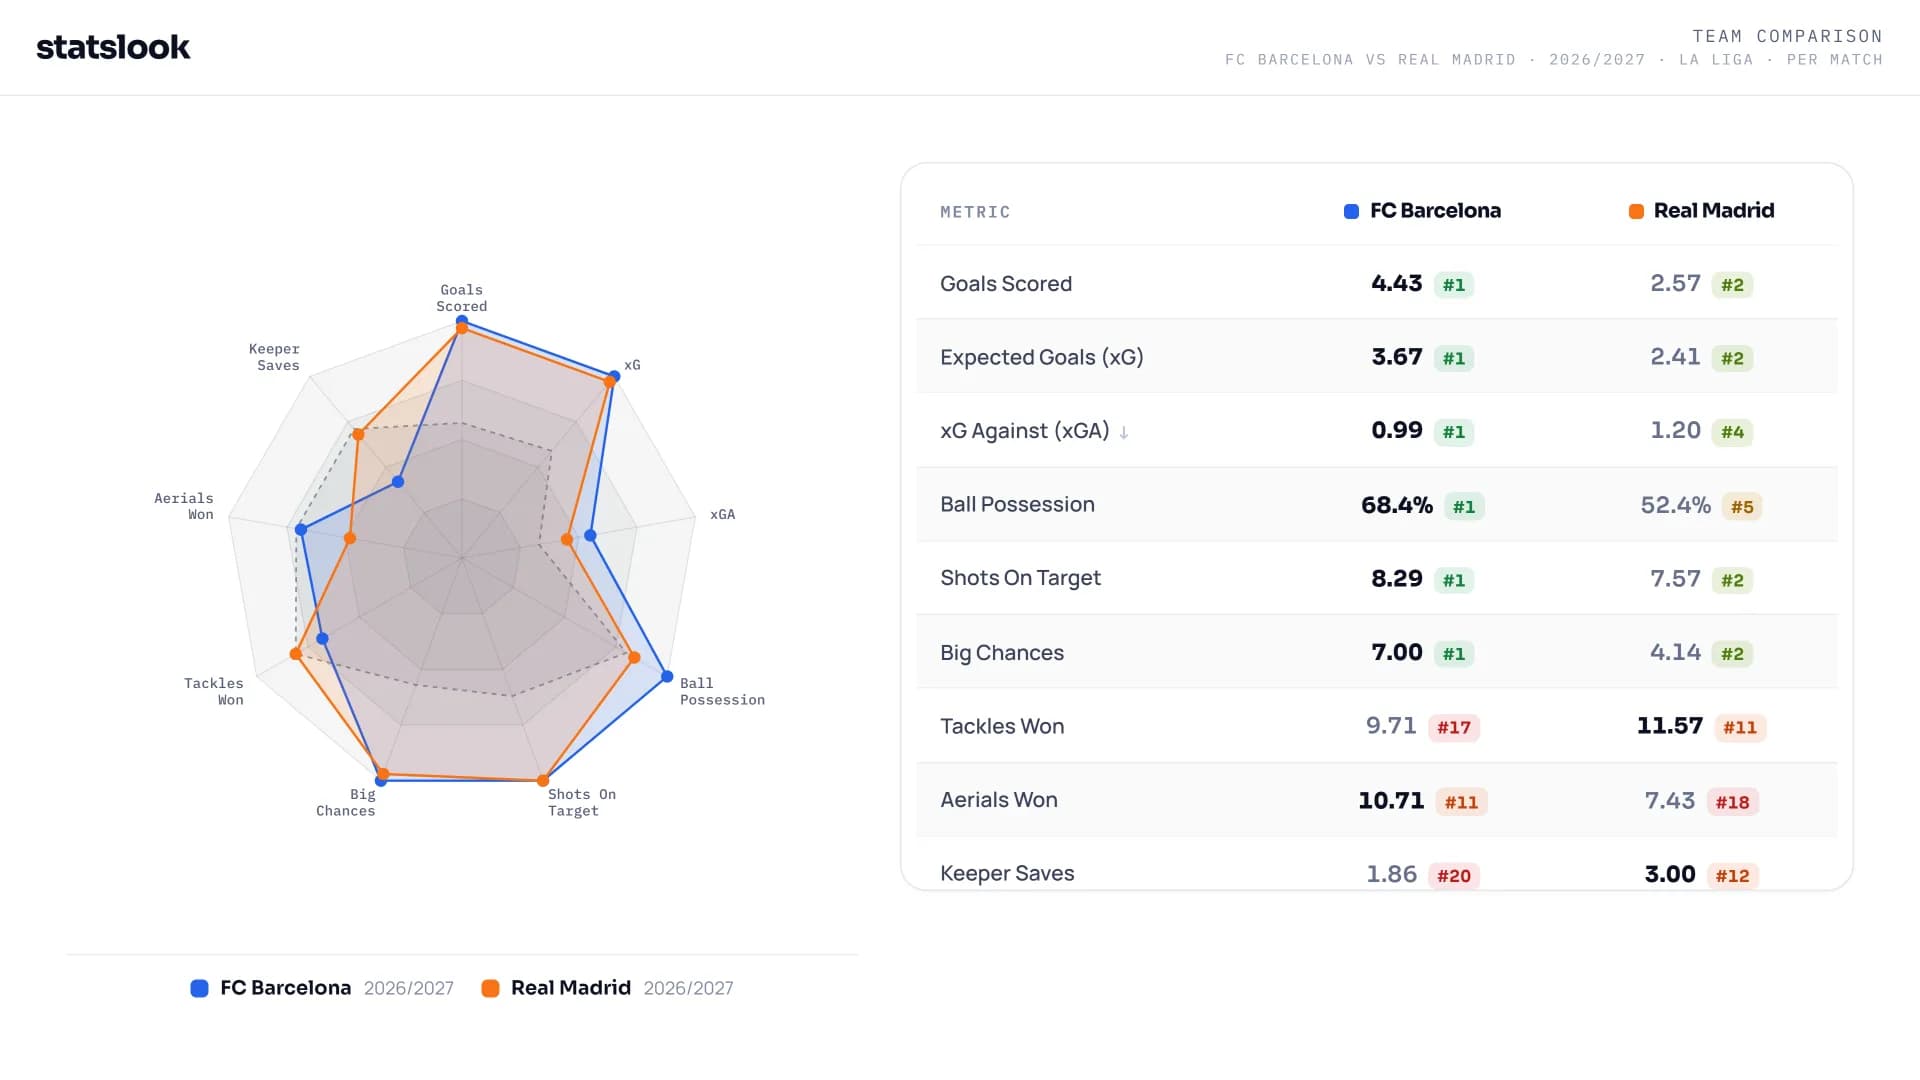
Comparing football teams takes more than points, goals and possession. Select up to 10 metrics on StatsLook to analyse attacking quality, defending and playing style.
It is easy to say which football team is better. Explaining it with data is harder.
League position, wins and goals scored offer a useful first impression. But they do not always explain how a team plays, whether its results are sustainable or where it may hold an advantage over another side.
A team can score heavily without creating the highest-quality chances. Another can concede very few goals while regularly allowing opponents into dangerous shooting positions. A high possession figure can reflect control, but it can also hide a large volume of safe, low-impact passing.
A meaningful team comparison does not depend on one statistic. It starts with the right question and uses the metrics that can answer it.
StatsLook’s Team Comparison tool lets you select up to 10 metrics to build your own comparison between two teams. Instead of looking only at results, you can examine attacking quality, build-up play, creativity, defensive resilience, physical output and goalkeeping contribution in the same analysis.
Try the tool here: https://statslook.com/lab/team-comparison
Why team comparison is more than a league table
Two teams on the same number of points can play completely different football.
One may create a high volume of dangerous attacks in the opposition half. Another may produce fewer attacks but turn a short period of clinical finishing into more goals. One side may dominate the ball, while the other creates better opportunities through transitions and set plays.
That is why “Which team is better?” is not enough. More useful questions include:
Which team creates the higher-quality chances?
Which team allows fewer good chances to opponents?
Does possession lead to progression and attacking production?
Which team builds through passing, and which plays more directly?
Which side is stronger in duels and aerial battles?
How much are results being influenced by goalkeeping?
Team comparison helps turn those questions into a clearer picture.
Start with the question, then select the 10 metrics
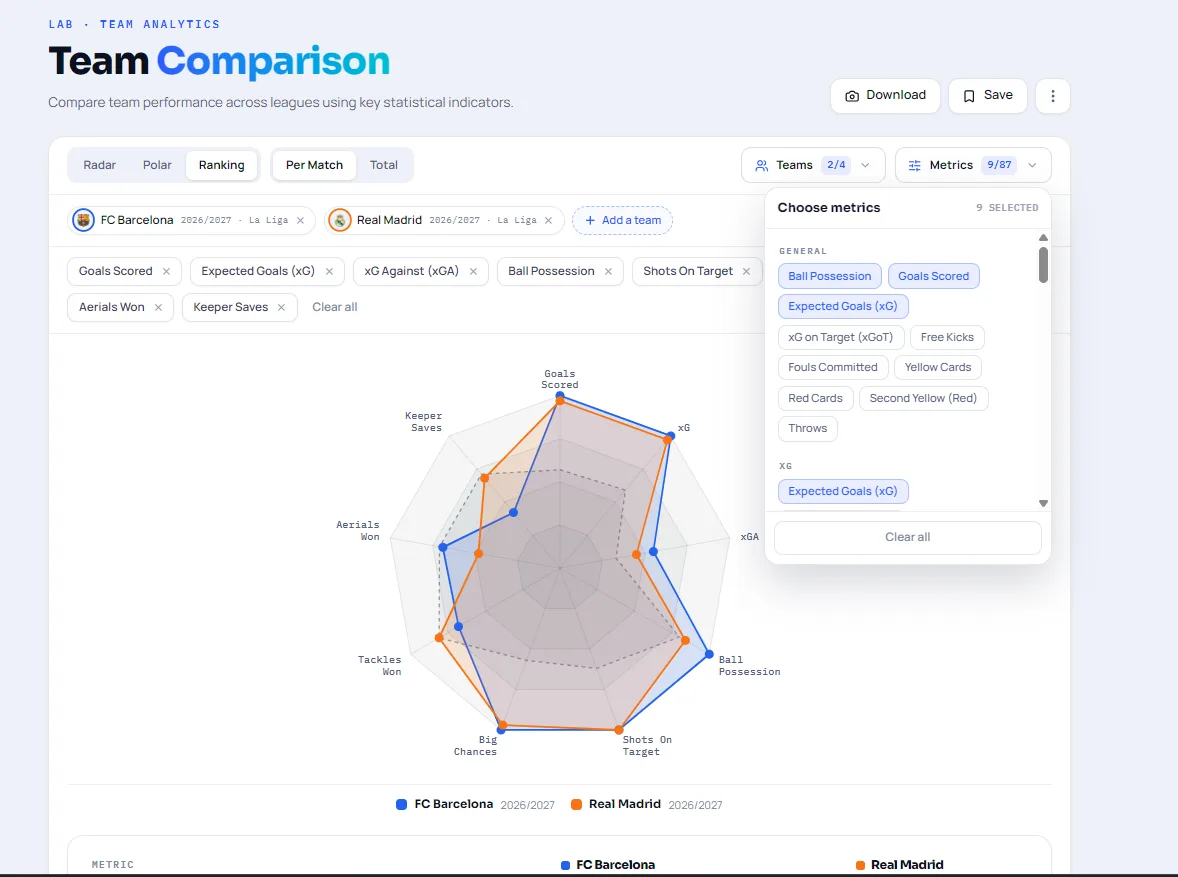
The ability to select up to 10 metrics is not a limitation. It creates analytical discipline.
Adding every available number to one screen rarely produces a better conclusion. A comparison should be built around the issue you want to investigate. Before a match, you may want to focus on attacking output. When assessing a team’s decline, defensive process metrics may matter more. When comparing playing styles, build-up and creative data become more useful.
StatsLook’s metrics are organised across eight areas:
General
xG
Attacking
Build-up
Creative
Defending
Physical
Goalkeeping
The right comparison uses a focused selection from these groups, rather than treating every metric as equally important.
How to compare attacking strength
Goals scored matter, but they are not the entire attacking story.
Goals can be influenced by finishing, set pieces, opposition mistakes or a short-term run of unusually high conversion. To understand attack properly, goals should be read alongside the quality and volume of chances a team creates.
A useful 10-metric attacking set could include:
Goals scored
Expected goals (xG)
Shots on target
Total shots
Shots inside the box
Big chances
Key passes
Chances created
Passes in the final third
Dangerous attacks
This selection shows more than who has scored more. It helps reveal which team creates chances more frequently, more efficiently and with greater quality.
The relationship between goals and xG is particularly important. If a team is scoring far above its xG, it may have excellent finishers or be enjoying a period of unusually efficient conversion. That does not automatically make the performance unsustainable, but it deserves context. If the opposite is true, a team may be creating enough to score more but failing to turn chances into results.
Possession is not the same as progression
Possession is one of football’s most-used statistics. It is not a complete measure of quality on its own.
A side can have 60% of the ball but spend much of that time circulating safely in its own half. Another can have less possession yet move the ball into dangerous areas more effectively.
To assess build-up play, try this comparison set:
Ball possession
Passes
Accurate passes
Pass accuracy
Short passes
Long balls
Long balls won
Long balls won percentage
Passes in the final third
Possession lost
This does not simply compare passing quality. It compares passing preference and progression.
A high pass-completion rate is not automatically evidence of a strong attack. Passes in the final third and possession lost provide a better indication of whether that possession is advancing play and how much risk a team takes to do so. Long-ball volume and long-ball success can also show how controlled or direct a team’s approach is.
Which creative metrics matter?
Some teams take a large number of shots but struggle to break opponents down. Others create fewer shooting situations but generate clearer opportunities.
StatsLook’s creative metrics include assists, big chances, key passes, chances created, total crosses, accurate crosses, cross accuracy and passes in the final third.
Together, they help answer questions such as:
Is a team creating structured chances or relying on individual moments?
Does it attack through wide areas or through the centre?
Are crosses part of an effective attacking plan or simply repeated delivery into the box?
Is chance creation translating into goals?
For example, a high total of crosses is not enough to describe a good attack. It should be considered alongside accurate crosses, big chances and shots inside the box. Otherwise, it may only show that a team is sending the ball into the area often, not that those actions are creating quality opportunities.
Defending is not just about goals conceded
Conceding few goals can indicate strong defending. But it can also be affected by excellent goalkeeping, poor opposition finishing or a low volume of high-probability shots.
Defensive analysis needs to examine both the outcome and the process behind it.
A useful defensive 10-metric set could include:
Goals conceded
Expected goals against (xGA)
Tackles
Tackles won
Tackle success percentage
Interceptions
Successful interceptions
Ball recoveries
Blocks
Clearances
This combination shows not only what the defence has conceded, but also how it responds when opponents attack.
The difference between xGA and goals conceded is especially valuable. A team that has conceded few goals despite a high xGA may still be allowing opponents too many high-quality chances. Conversely, strong ball recoveries and successful interceptions add context by showing how often a side disrupts opposition moves before they become shots.
Physical match-ups can shape the game
Some matches are decided by technical quality. Others are decided by duels.
When two teams have comparable attacking data, ground duels, aerial battles, dribbling success and ball retention can change the balance of an encounter.
StatsLook’s physical section includes total duels, duels won, duel success percentage, ground duels, aerial duels, dribble attempts, successful dribbles, headers, fouls drawn and dispossessions.
The key is not to read total duels in isolation. A team involved in more duels is not automatically more dominant; it may simply be spending more time defending without the ball.
Read duel success alongside possession, ball recoveries and possession lost. That gives a more useful picture of whether a team is winning physical battles while controlling the game, or merely reacting to it.
Read goalkeeping in context
Goalkeeping data is often reduced to saves. But a high save total can tell two very different stories: the goalkeeper may be performing exceptionally well, or the team may be allowing far too many shots.
StatsLook lets you compare keeper saves, saves inside the box and goal kicks.
To understand the goalkeeper’s role within the team, assess saves together with xGA and goals conceded. This moves the analysis beyond “Who made more saves?” and towards a more useful question: “How often is the defence leaving its goalkeeper exposed?”
Do not use the same metrics for every comparison
Using the same 10 statistics every time limits the value of the tool.
Before a derby or major fixture, you might prioritise attacking production. After a managerial change, build-up and creative metrics may be more revealing. When a team’s form declines, xGA, possession lost, tackle success and big chances can provide stronger clues than league position alone.
Good analysis is not about adding more data. It is about removing the data that does not answer the question.
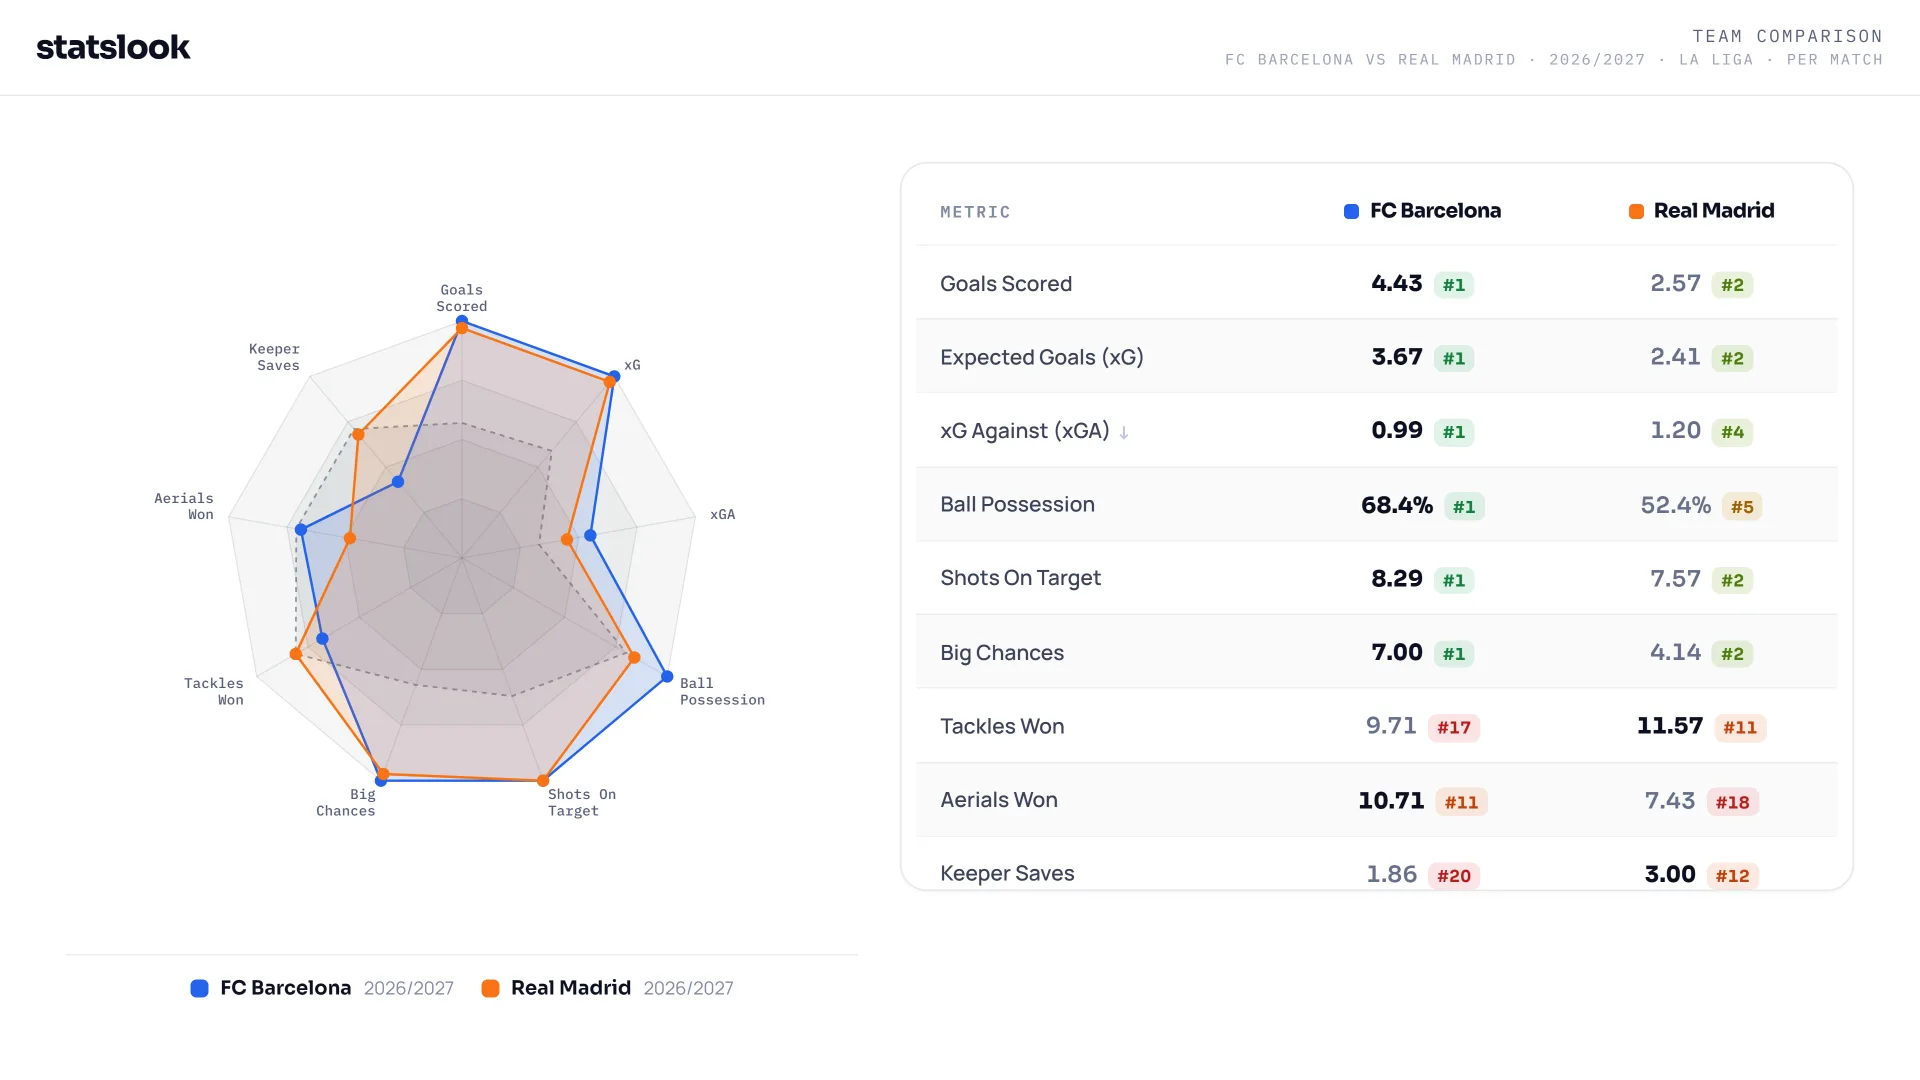
How to use StatsLook Team Comparison
Select the two teams you want to compare.
Decide what you want to analyse: attack, defence, build-up play, creativity or physical match-up.
Choose up to 10 metrics relevant to that question.
Read the results as connected indicators, not isolated numbers.
Change the metric set when you move to a different question.
Compare the same two teams again through different data lenses to understand more of their game.
A team comparison is not designed to deliver a final verdict on which side is better. It is designed to show where each side is stronger, weaker and stylistically different.
Compare two teams through the metrics that matter to you with StatsLook Team Comparison: