Europe’s Attack Map: Taking More Shots Isn’t Enough
We compared the attacking profiles of all 96 teams across Europe’s top five leagues using StatsLook data. Barcelona combine elite shot volume with unmatched shot quality, Manchester City follow a more selective model, while Manchester United and Como show why a high shot count does not always translate into a strong attack.

When attacking strength is discussed, goals, xG and total shots are usually the first numbers people reach for. But two teams can arrive at the same xG total in completely different ways.
One may overwhelm opponents with more than 20 shots per match. Another may shoot far less often but generate significantly better chances.
That distinction matters.
The StatsLook Data Journalism Team reviewed the early 2026/27 attacking data from all 96 teams across the Premier League, La Liga, Serie A, Bundesliga and Ligue 1 to examine not only how much teams shoot, but how much value they generate with each attempt.
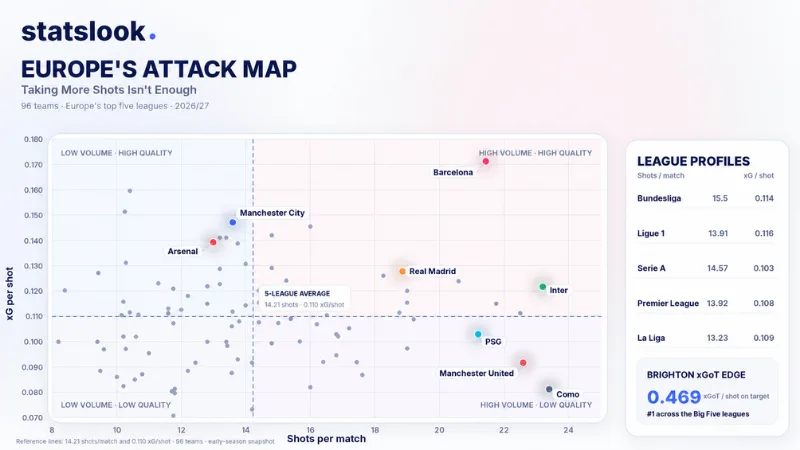
Across the five leagues, the average team is producing 14.21 shots per match and 0.110 xG per shot.
Those two reference points divide the attacking landscape into four broad profiles: high volume and high quality, low volume and high quality, high volume and low quality, and teams below average in both areas.
At the very top of that map sits Barcelona.
Barcelona: Europe’s Benchmark for Shot Volume and Quality
Barcelona are averaging 21.43 shots per match, the sixth-highest figure among the 96 teams.
But volume is not what truly separates them.
They lead the five major European leagues with 3.67 xG per match, while their 0.171 xG per shot is also the highest figure in the entire dataset.
Barcelona are therefore doing two difficult things simultaneously: generating a huge number of shots without allowing the average quality of those attempts to fall.
Very few teams manage that balance.
Their 7.0 big chances per match are also the highest figure across the 96-team sample.
Around 73% of Barcelona’s attempts come from inside the penalty area, while their shots on target generate an average of approximately 0.434 xGoT per attempt on target.
Their attacking profile is not simply about territorial dominance or sustained pressure. A substantial share of that volume is being converted into high-value shooting opportunities.
At this early stage of the season, Barcelona have the most complete attacking profile in Europe’s top five leagues.
High Volume, High Quality: Inter and Real Madrid
Inter and Real Madrid occupy the same high-volume, high-quality area of the map, although they reach it in different ways.
Inter are averaging 23.2 shots per match, the second-highest total among the 96 teams.
Those attempts produce 2.82 xG per match, second only to Barcelona.
Their 0.122 xG per shot does not reach Barcelona’s extraordinary level, but it remains comfortably above the five-league average.
Inter are also producing 5.6 big chances, 17.4 key passes and 17.2 chances created per match, showing that their shot volume is supported by substantial creative production.
Real Madrid occupy a more balanced position.
They are producing 18.86 shots, 2.41 xG and 0.128 xG per shot.
Madrid rank sixth for xG and 15th for average shot quality.
That profile separates them from Europe’s most extreme volume teams. They do not shoot as frequently as Inter and they do not match Barcelona’s shot quality, but they remain comfortably above average in both dimensions.
Their 16.29 key passes and 16.29 chances created per match also indicate that this output is not simply a product of shooting frequency.
Manchester City’s Selective Attack: Fewer Shots, More Value
Manchester City sit in a very different part of the map.
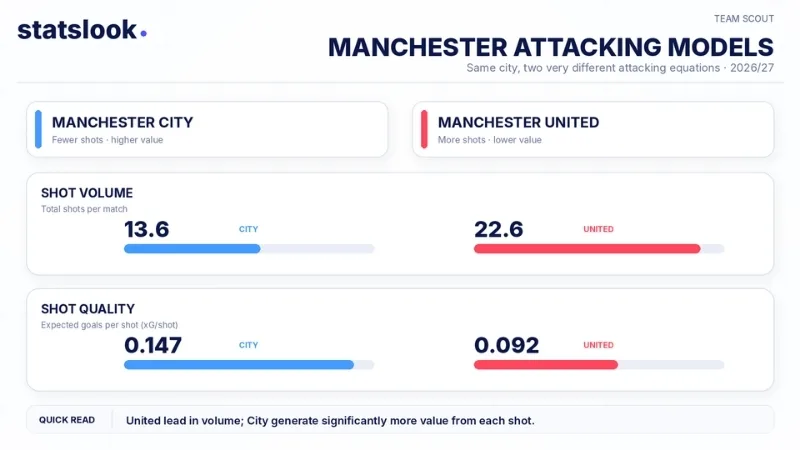
City are taking only 13.6 shots per match.
That is below the five-league average of 14.21 and places them just 48th among the 96 teams for shot volume.
Yet those attempts are worth 0.147 xG per shot.
That is the fourth-highest shot-quality figure in Europe’s top five leagues.
The contrast provides a clear picture of City’s early-season attacking model: they are not attempting to maximise shot count. They are reaching better shooting situations.
Their shot-location data reinforces that interpretation.
Approximately 76.5% of City’s shots come from inside the penalty area, the third-highest rate in the entire sample.
A relatively modest shot count therefore should not be confused with weak attacking production. City shoot less frequently, but the average value of those attempts is extremely high.
Arsenal show a similar profile.
They are averaging only 13.0 shots per match, yet their 0.139 xG per shot ranks ninth among the 96 teams.
In both cases, shot selection is currently more distinctive than shot quantity.
Manchester United Have a Quality Problem, Not a Shot Problem
Manchester United represent almost the opposite attacking profile.
United are attempting 22.6 shots per match.
Only Como and Inter are shooting more frequently across Europe’s top five leagues.
Yet those attempts generate only 2.07 xG per match.
Their average shot is worth just 0.092 xG, leaving United 79th among the 96 teams for shot quality.
In other words, the problem is not getting possessions to end in shots.
The issue is the value of those shots.
Only around 56% of United’s attempts come from inside the penalty area, compared with a five-league average of roughly 65%.
Their creative numbers, however, remain strong.
Manchester United are producing 16.4 key passes per match, seventh in the dataset, and 16.2 chances created, ninth.
That distinction is important.
United are reaching the final third, creating passing opportunities and generating a very high number of attempts.
But the final stage of those attacks is not producing shooting situations of equivalent quality.
The early-season data therefore points less towards a lack of attacking activity and more towards a problem with the quality of the final action.
Como: Why Shot Volume Alone Cannot Explain Attacking Strength
Como provide perhaps the clearest example of why total shots cannot be treated as a standalone measure of attacking quality.
The Serie A side are averaging 23.4 shots per match, the highest figure across all 96 teams.
Their average shot, however, is worth just 0.081 xG.
That places Como 92nd out of 96 teams for shot quality.
Their creative production is not low either.
Como are second in the entire sample with 17.8 key passes per match and second with 18.2 chances created.
They are therefore not a team struggling to reach attacking areas or develop opportunities.
Quite the opposite.
The problem is that an enormous amount of attacking activity is not being converted into equally strong shooting positions.
Como are the most striking example in the dataset of the difference between attacking volume and attacking value.
Europe’s highest-volume shooting team is nowhere near Europe’s best team for shot quality.
Paris Saint-Germain offer another version of the same broader issue.
PSG are producing 21.2 shots and 2.18 xG per match, yet their average attempt is worth only 0.103 xG, below the five-league average.
The location of those shots is particularly notable.
Only around 52% of PSG’s attempts come from inside the penalty area, one of the lowest rates among the 96 teams.
At the same time, PSG are generating 16.6 key passes and 16.8 chances created per match.
Like United and Como, they are not struggling to reach productive attacking areas.
A significant part of their shot volume, however, is coming from lower-value locations.
Brighton’s xGoT Edge: Exceptional Threat After Hitting the Target
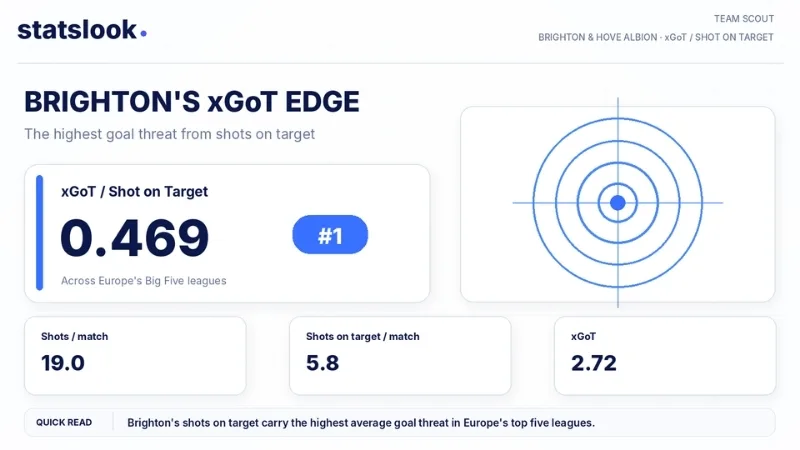
Brighton stand out for a different reason.
They are producing 19 shots and 2.19 xG per match, placing them among Europe’s higher-volume attacking teams.
But their strongest distinction appears after the shot has been taken.
Brighton’s xGoT per shot on target is 0.469.
That is the highest figure among all 96 teams.
Their shots that reach the goalkeeper are therefore carrying more average goal threat than those of any other team in the five major leagues.
Brighton are also scoring 3.20 goals per match.
That puts their actual scoring output approximately 1.01 goals above their xG per match, the largest positive gap in the sample.
Whether that level of finishing can be maintained over a larger sample is another question.
But in the opening phase of the season, Brighton’s on-target shooting has been exceptionally dangerous.
The Attacking Character of the Big Five Leagues: Bundesliga vs Ligue 1
The team-level map also reveals differences between the leagues themselves.
The Bundesliga has the highest average shot volume, at 15.5 attempts per team per match.
Its average 0.114 xG per shot is also above the overall five-league benchmark.
Ligue 1, meanwhile, averages only 13.91 shots per match but leads all five competitions for shot quality at 0.116 xG per shot.
The Premier League averages 13.92 shots and 0.108 xG per shot.
La Liga sits at 13.23 shots and 0.109 xG per shot, producing similar average quality with slightly less shooting volume.
Serie A teams average 14.57 shots per match, but their 0.103 xG per shot is the lowest average among the five leagues.
The sample remains early, but the first weeks already reveal distinct attacking tendencies across the competitions.
Conclusion: No Single Number Can Explain Attacking Strength
The first weeks of the season reveal several very different ways of building a productive attack.
Barcelona combine elite shot volume with elite shot quality.
Inter overwhelm opponents through extremely high shooting and creative volume.
Manchester City and Arsenal are more selective, extracting greater value from fewer attempts.
Real Madrid sit between those extremes, maintaining strong numbers in both dimensions.
Manchester United, Como and, to some extent, PSG are generating plenty of attacking activity but are not converting that activity into shots of equivalent quality.
That is why asking only how many shots a team takes is not enough.
The more important questions concern where those shots come from, how much scoring probability they carry and how efficiently attacking possessions are being converted into genuinely dangerous attempts.
As the season progresses, some of these profiles will inevitably change.
For now, Europe’s early attacking map makes one thing clear: there is no single route to attacking success.
Which team’s attacking profile has impressed you most so far this season? Let us know in the comments.
Methodology and Data Notes
This analysis covers all 96 teams competing in the Premier League, La Liga, Serie A, Bundesliga and Ligue 1.
The data reflects the current stage of the 2026/27 season, with teams having played between four and seven league matches depending on the competition.
All team metrics are evaluated on a per-match basis.
xG per shot is calculated by dividing a team’s expected goals per match by its total shots per match.
League averages are calculated from the mean per-match values of all teams within each competition.
Because the sample is still small, unusual rates and rankings may change substantially as the season progresses.
This should therefore be read as a snapshot of early-season attacking profiles rather than a final ranking of team quality.